


Outdoor Industry Association Releases 2024 Outdoor Brand Benchmarking Report to Help Members Rise Above Competition
A Special Report from Chris Denny and our friends at the Outdoor Industry Association
New report offers key finance and business operations benchmarks that enable brands to make more informed decisions that drive growth and profitability
BOULDER, CO (August 19, 2024) – A member-led collective and the outdoor industry’s catalyst for meaningful change, Outdoor Industry Association (OIA) has released its 2024 Outdoor Brand Benchmarking Report, presenting a detailed, straightforward analysis of the financial and operating characteristics of outdoor manufacturers for fiscal year 2023. The results show that the typical firm generated sales of $9,786,731 and a pre-tax profit of 11.9%. Sales for the typical high-profit firm were $6,768,674 with a profit of 18.5%.

Visit the OIA website for a full array of research reports…
OIA sources and gleans insights to uncover narratives around who’s doing what, when, and how outdoors. We create thoughtful stories in custom, easy-to-digest formats that help our members build or evolve business strategies, targeted product road maps, and marketing plans for target customer alignment and better business outcomes.
As the sole and trusted source for benchmarks in the outdoor industry, OIA’s 2024 Outdoor Brand Benchmarking Report focuses on key business fundamentals, including:
- Financial Performance: Key financial ratios and detailed indicators across Profit and Loss and Balance Sheet statements, such as revenue growth, profit margins, and inventory turnover.
- Business Operations: Benchmarks focus on metrics such as SKU count, sales channel mix, marketing mix and ROI, sourcing mix, number of employees, and sales per employee.
- Actionable Best Practices: Tailored strategies cover revenue and gross margin optimization, asset management, and payroll control.
- Targeted Insights: Groupings by company size and product line help pinpoint opportunities within specific industry segments and compared to top performers.

“As the outdoor market continues to evolve at a rapid rate, it’s essential to know where your business stands versus the competition,” said Kent Ebersole, President of OIA. “The 2024 Outdoor Brand Benchmarking Report provides decision-makers access to data across all major business functions so that they can be equipped with the strategic intelligence needed to drive growth, efficiency, and profitability. It’s with this level of deep market understanding that industry-leading brands are created, and OIA is here to help our members get there.”
The benchmarking data was anonymously compiled from 46 outdoor industry brands across a range of company sizes and product categories.
For over thirty years, OIA has helped its members better understand the markets and people they serve by providing industry-leading research and expert perspectives on participation trends, market forces, and consumer insights. This new Benchmarking Report expands the value of OIA membership and enables outdoor brands to access data worth thousands, unavailable anywhere else.
The full report is now available to study participants and OIA Leadership Members (Manufacturer, Supplier, Distributor, Retailer, Sales Rep categories). OIA Support and Support+ Members have access to the 8-page Executive Summary. OIA has also released key insights of the report to the public to foster overall industry growth. To access the key insights and to learn more about OIA membership, please visit the OIA website.
2024 KEY INSIGHTS
Know where you stand versus the competition in a dynamic market and make informed decisions to drive growth and profitability from the only benchmarking report for outdoor brands.
Financial Performance
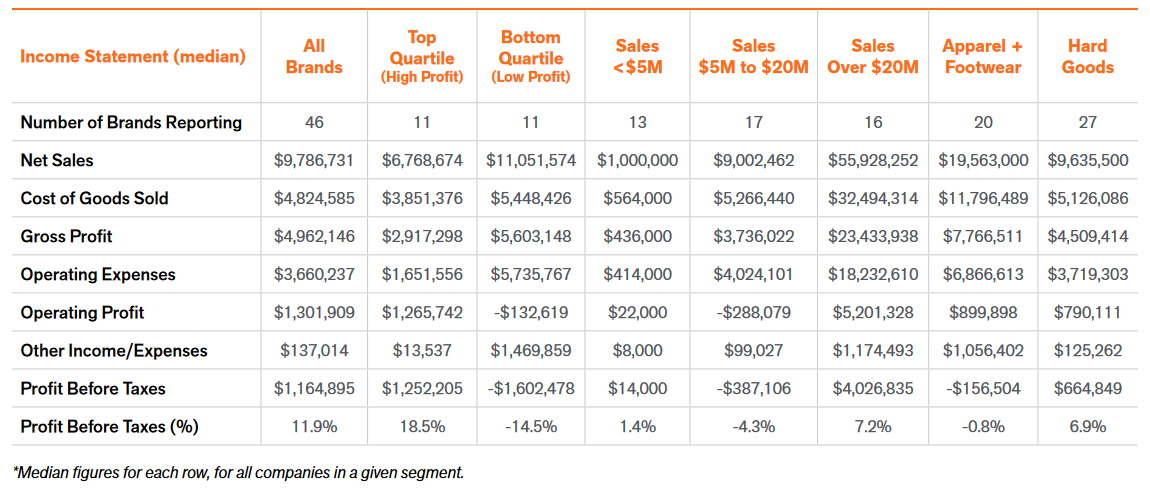
*Median figures for each row, for all companies in a given segment.
This profit performance in the top quartile (i.e. high-profit firms) is due to revenue growth, conservative cost management, and limited discounts. Additional details and other financial benchmarks including balance sheet, key ratios, and asset productivity are available in our full report.
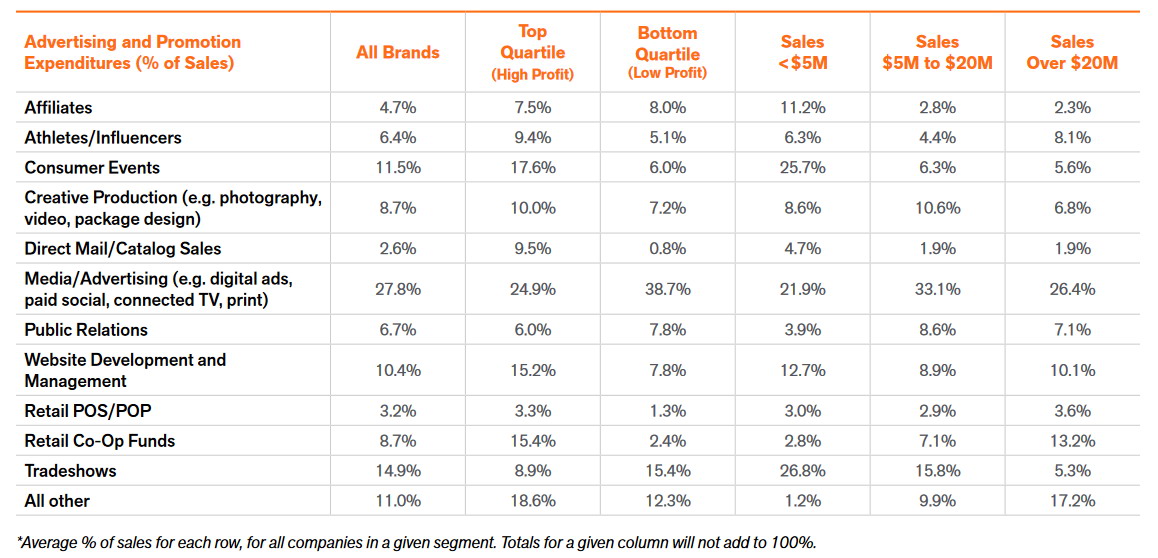
Business Operations
In the Business Operations section of our report, product, sales, marketing, supply chain, and employees take center stage. For example, one finding in the Advertising and Promotions section is that among all reporting brands the average spend on trade shows is 14.9% of the budget. However, trade shows hold more importance for smaller companies: their average trade show spend is 26.8% of the budget.
Conclusion
Overall, the typical outdoor company has had a difficult run over the past two years. After a surge in revenue in 2021 and 2022, a lull in business and increasing costs have bruised the bottom line. As pandemic-related high costs begin to fall, and as demand stabilizes and increases with the influx of new outdoor participants, most brands will have opportunities to increase profit. Comparing financial and business operations performance is key to initiating necessary improvements and generating steady revenue growth.
Methodology
This report presents a detailed, straightforward analysis of the financial and operating characteristics of 46 participating outdoor manufacturers for fiscal year 2023. OIA invited 716 outdoor manufacturers, including members and non-members of the Association, to respond to an online survey open between April 5, 2024, and May 12, 2024. We received 96 responses, of which 46 were at least 80% complete and valid. Most of the financial
performance figures in this report are based on median results for each variable to aid in comparative value and transparency. Business operations data is based on averages (mean) to provide more granularity in that data.
Know where you stand versus the competition in a dynamic market and make informed decisions to drive growth and profitability from the only benchmarking report for outdoor brands.
Ready to Dig Deeper? Ten additional pages of detailed financial statements and business operations metrics are available to OIA Leadership members.
Get the full report to review in-depth income statements and balance sheets plus additional financial ratios, as well as key business operations benchmarks on company structure, sales per SKU, wholesale and direct-to-consumer sales by channel, sourcing, and manufacturing by country, approaches to fulfillment, dollars spent on consultants, and more. Groupings by company size and product line help you identify opportunities within your specific industry segment and versus top-performing companies.
Contact membership@outdoorindustry.org today to join OIA and gain access to data unavailable anywhere else.
About Outdoor Industry Association
Based in Boulder, Colorado, with offices in Washington, D.C., Outdoor Industry Association (OIA) is a catalyst for meaningful change. A member-based collective, OIA is a passionate group of business leaders, climate experts, policy makers and outdoor enthusiasts committed to sustainable economic growth and climate positivity while protecting – and growing access to – the benefits of the outdoors for everyone. For more than 30 years, OIA has catalyzed a thriving outdoor industry by supporting the success of every member company across four critically aligned areas: market research, sustainability, government affairs, and inclusive participation. OIA delivers success for its members through education, events, and business services in the form of solutions and strategies, consultation, collaboration, and opportunities for collective action.
For more information, please visit outdoorindustry.org
* Full report available to OIA Leadership Members (Manufacturer, Supplier, Distributor, Retailer, Sales Rep categories). OIA Support and Support
+ Members have access to the 8-page Executive Summary.