


By Nick Farnell
Are you maximizing your profits on every pre-owned RV? While the average Canadian price hovers around $33,800, that figure does not tell the entire story.
First off, there are three common ways to calculate the “average” price. More technically this is called measures of central tendency which are statistical values that describe the centre or the average of a dataset. The goal is to get a general idea, in one value, to describe all of our data. In our case it would be to get a better understanding of what a common pre-owned RV might be listed for on a dealership lot.
These three calculations, mean, median, mode are as follows.
The mean is calculated by adding all values together (prices) divided by the total number of values (number of sales). For Canadian pre-owned RV sales in the last two years, this result would be approximately $50,800. Note that this is substantially higher than our median value described above since a few large values can skew that number higher. For example, if a dealer sells five or six pre-owned Tent Trailers and one relatively new Class A Motorhome, the mean would not be a good representation of any of those sales.
The median is the middle value when arranged in order from smallest to largest (or largest to smallest). When looking at prices, or income levels, median can be a more appropriate calculation of that average value. The median price for pre-owned RVs sold in Canada in the last two years is approximately $33,800.
Mode is simply the value that occurs most frequently in a dataset. Prices vary considerably in pre-owned RVs and the mode or most frequently occurring price is not a valuable calculation when trying to get an understanding of average prices.
For more detailed pricing data, visit wtrfll.ca and subscribe to our web based sales dashboards.
To extend this idea further, we can assign prices to specific “bins”, for example groupings of $10,000. In this case, prices between $10,000 and $20,000 would be grouped together, $20,000 to $30,000 would be grouped together, and so on in increments of $10,000.
When grouping prices into these bins of $10,000 and grouping by type, the most common are:
- Travel Trailers under $50,000
- Fifth Wheels from $10,000 all the way to $50,000
- Class A Motorhomes over $150,000
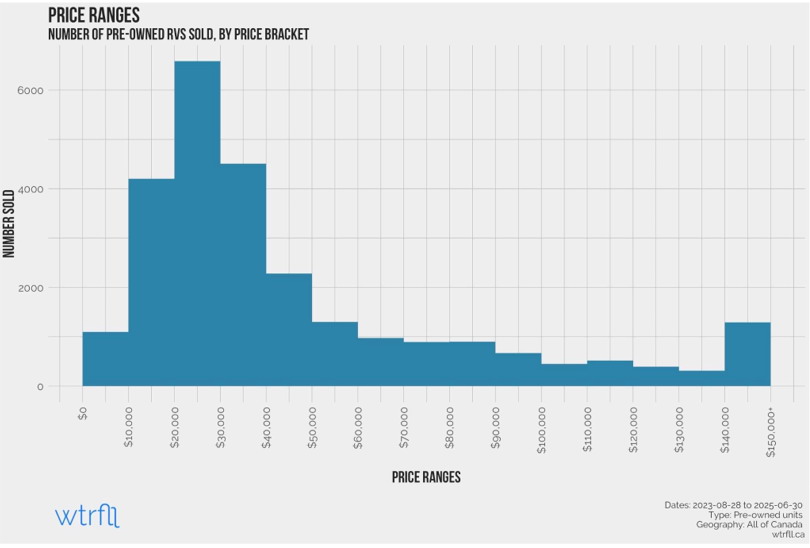
This approach is called a frequency distribution, which is a summarized grouping of data which involves categorizing data in to specific groups (the bins discussed earlier) then counting the number of occurrences in each of those groups. This can be very helpful when trying to get a better picture of how pricing can change within and across different types of RVs. We can visualize these distributions with a histogram shown below.
This histogram shows the “bins” or categories across the bottom and a count of how many values fall within those bins on the vertical axis.
While it is helpful to see these price distributions, narrowing down to specific RV types will give even more clarity. Of course the average Tent Trailer has a much lower price than the average Class A Motorhome, and being able to visualize these distributions is a useful exercise.
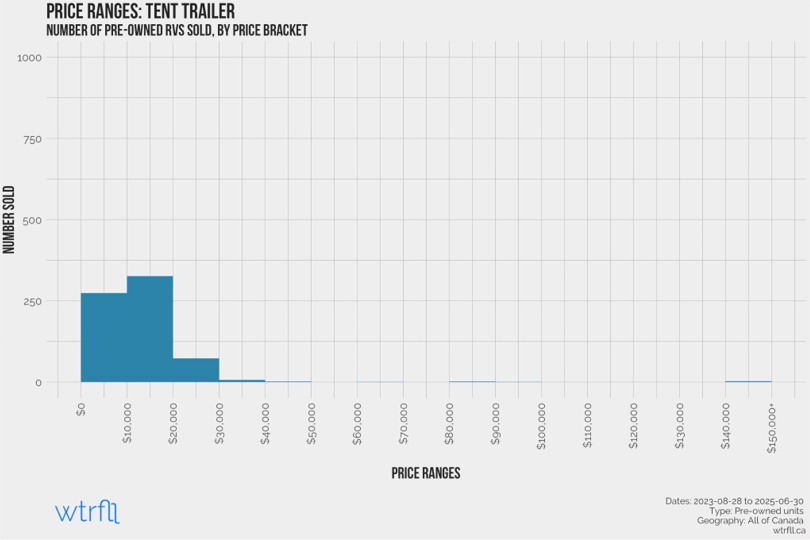
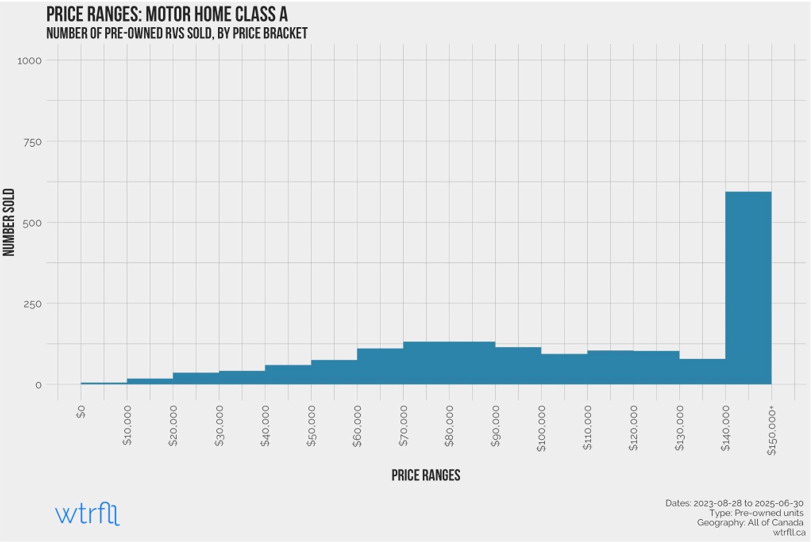
As shown in the histograms above, there is a substantial difference between Tent Trailers and Class A Motorhomes. Most Tent Trailers are priced between $10,000 and $20,000, and almost none priced greater than $30,000. Class A Motorhomes are at the opposite end of the spectrum with most priced higher than $150,000.
The age of a pre-owned unit also has a significant impact on price. When considering age and price brackets, the most common groupings are
- 2 year old units priced between $30,000 and $40,000
- 3 year old units priced between $30,000 and $40,000
- 3 year old units priced between $20,000 and $30,000
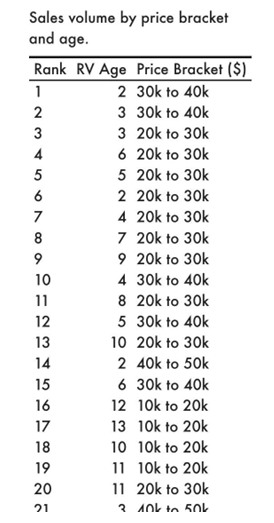
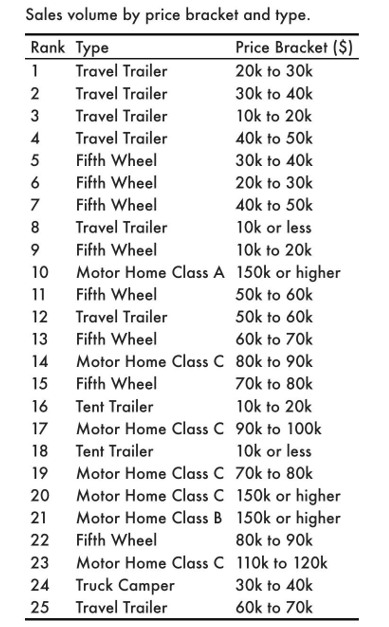
Sales volume by price bracket and age
Price is not the only variable to consider from a dealer’s point of view. The amount of time that pre-owned units sit on the lot is another major factor.
There is a notable relationship between price and time on lot. Lower priced units (under $20,000) tend to move quicker than higher priced units (over $140,000). There are many factors that can explain this, but the most obvious is that there are more people who are willing and able to spend $20,000 on an RV than there are who are willing and able to spend $140,000 on an RV. Look out for a deeper dive into data about “time on lot” in a future article.
By embracing a data-driven approach, dealerships can navigate the dynamic pre-owned market with greater confidence, optimizing inventory, accelerating sales, and driving profitability. RV dealers can subscribe to our real time web based dashboards, with local pricing data at wtrfll.ca.
About the author…

Nick Farnell, MBA
Nick Farnell is a professor of business analytics and runs the consulting firm wtrfll, focusing primarily on competitive intelligence and data driven insights. When not in front of a computer, he is spending as much time as possible in one of Ontario’s provincial parks with his young family.
Please vist https://wtrfll.ca/ to see how Nick and his team have helped organizations use data and analytics to better understand their customers and competitors.